Introducing OnPing Plunger - Powered by Pak AI
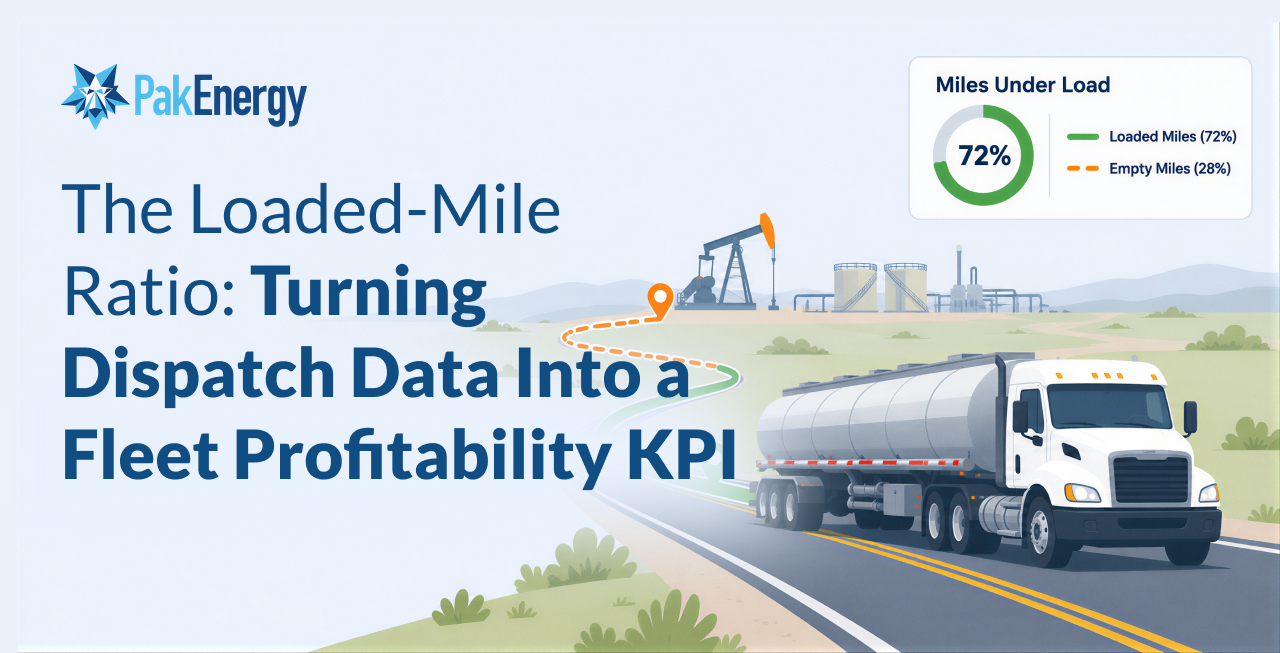
A truck can be busy for ten hours and still have a lousy day. The engine ran. The driver worked. Fuel burned. Tires turned. From a distance, everything looked productive. Then you look at how many of those miles were actually traveled under load. For fleet owners and trucking managers, that distinction matters. Miles with a paying commodity on the truck and miles spent repositioning for the next load do very different things to the economics of a shift. Looking only at load counts or total mileage can hide that difference. The loaded mile ratio shows how much of your fleet’s movement is actually generating revenue.
By comparing loaded miles with total miles, bulk haulers can get a clearer picture of how efficiently trucks are being dispatched. Pair that metric with shift-level dispatch analytics, deadhead mileage, estimated times, and driver availability, and it becomes more than another number on a dashboard. It becomes a way to ask a better question: How much of our fleet activity is actually productive?
Busy Trucks Can Still Be Inefficient Trucks
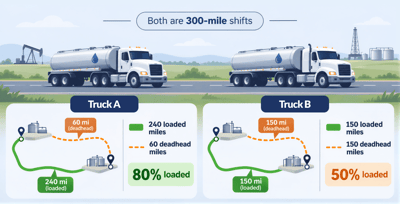
Fleet utilization can be deceptive. Imagine two drivers who each travel 300 miles during a shift. Driver A spends 240 miles under load. Driver B spends 150 miles under load. Both trucks traveled the same distance. Both drivers may have looked equally busy on the dispatch board. But the operational picture is very different. Driver A's loaded-mile percentage is 80%. Driver B's is 50%. That gap gives the fleet manager somewhere useful to investigate.
Maybe Driver B was assigned loads with awkward pickup and drop-off combinations. Maybe the driver began the shift too far from the first pickup. Maybe a last-minute reroute created extra empty travel. Or perhaps geography made the deadhead unavoidable. The ratio does not tell you why something happened. It tells you where to look. That is what makes it useful as a fleet performance metric.
What Is the Loaded Mile Ratio?
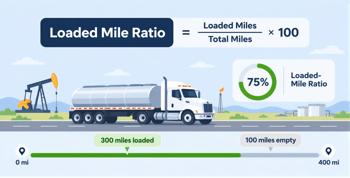
 At its simplest: Loaded Mile Ratio = Loaded Miles / Total Miles x 100
If a truck travels 400 total miles during a shift and 300 of those miles are loaded, its loaded mile ratio is 75%. The remaining 25% represents mileage traveled without a load. Simple math. Useful context.
A higher percentage generally means more of the truck's movement is associated with loaded transportation. A lower percentage can signal an opportunity to examine dispatch assignments, routing, scheduling, customer locations, driver positioning, or other operational factors. But there is an important caveat. There is no magic loaded-mile percentage that every bulk hauler should hit.
A crude hauler working remote leases faces different geography than a water fleet working a dense operating area. Aggregate, chemical, sand, and other bulk operations each have their own pickup patterns, destinations, customer requirements, wait times, and operating constraints. So the real value comes from establishing your own baselines and comparing performance in context. One shift against another. One load against its historical average. Similar drivers, customers, terminals, or operating areas against one another. That is much more useful than chasing an arbitrary industry number.
Deadhead Miles Are Only Half the Story
Deadhead miles gets plenty of attention, for good reason. Empty travel still consumes fuel, driver time, equipment life, and available hours. But measuring deadhead miles alone can make the conversation overly negative. Every bulk hauling operation will have some empty travel. A truck has to reach its next pickup somehow. The more useful question is how loaded and empty mileage relate to one another.
A fleet might reduce deadhead miles in absolute terms while also running fewer loaded miles. That does not necessarily represent an improvement. Another fleet might see deadhead mileage increase during a busy period but improve its loaded-to-total-mile percentage because productive mileage grew even faster. Context changes the story. The loaded mile ratio gives managers that context by putting the two sides of fleet movement into the same measurement.
PakEnergy's advanced dispatch board does exactly that. It displays loaded miles, deadhead miles, variances, estimated times, and the percentage of loaded to total miles at both the shift and load level. Now the dispatcher can see more than distance. They can see how that distance is being used.
Measure the Shift, Then Look Inside It
A fleet-level average is helpful. It can also hide a mess underneath. Suppose the entire fleet finishes the day at a 70% loaded-mile ratio. That sounds straightforward until you discover that half the drivers were around 85% while several others were below 50%. The average smoothed away the problem. Shift-level visibility makes the metric more actionable.
PakEnergy's advanced dispatch board allows dispatchers to examine loaded and deadhead mileage at both the driver-shift and individual-load level. The system can also highlight drivers and loads with high deadhead miles based on configured display settings, allowing the manager to work backward to identify the root cause. A shift has an unusually low loaded percentage. Which loads contributed to it? Was one assignment responsible for most of the deadhead miles? Did the route change during the day? Did the driver's location make an otherwise reasonable assignment inefficient?
That is where dispatch analytics start becoming operational rather than retrospective. You are no longer staring at yesterday's total and wondering why it looks bad. You can see the pieces that created it.
The Best Dispatch Decision Can Change After the Day Starts
The perfect dispatch plan has an annoying habit of becoming outdated. A load changes. A driver runs late. A customer adds work. A pickup gets canceled. Someone calls in sick. Traffic, weather, equipment, and field conditions join the party. Dispatchers adjust.
PakEnergy's advanced dispatch board is designed around that reality. When a driver's loads are added, removed, rearranged, or rerouted, the board updates the associated times and miles. That gives dispatchers a way to see how a change affects the rest of the driver's shift. This matters because a seemingly small assignment change can create a long empty leg later in the day. Drag one load to another driver and you may improve one schedule while making another worse. Mileage analytics give dispatchers a way to evaluate the tradeoff before the shift is over.
PakEnergy's broader bulk commodity transportation software also provides real-time location updates, load management, route management, scheduling, and dispatch capabilities across commodities including crude, water, aggregate, and chemicals. The result is a dispatch decision grounded in more than who appears available on the board. Location matters. Mileage matters. The rest of the shift matters too.
Loaded-Mile Percentage Can Reveal a Routing Problem
A low ratio does not automatically mean the dispatcher made a bad call. Sometimes the route itself is the issue. Maybe one customer's loads repeatedly create a long empty return. Perhaps a pickup location sits far outside the fleet's normal operating pattern. A particular drop-off may work well when paired with one origin but poorly with another. Those patterns can be hard to spot when dispatchers are focused on getting today's loads covered. Mileage data gives managers a chance to zoom out.
If a particular load consistently produces a weak loaded-mile percentage, that becomes a business question. Can loads be sequenced differently? Can another driver start closer to the pickup? Is there complementary work nearby? Does the rate adequately account for the empty repositioning required? Sometimes the answer will be that the deadhead mileage is unavoidable. That is useful information too. Once you know the true movement required to service a load, you can evaluate its economics with fewer assumptions.
More Loads Per Driver Is Not Always the Right KPI
Load count is wonderfully easy to understand. Driver A hauled five loads. Driver B hauled four. Therefore, Driver A had the more productive shift. Maybe. Those loads could be completely different. One driver may have handled shorter, tightly clustered movements. Another may have traveled long distances between remote pickup points. A third might have spent a large portion of the shift repositioning between assignments.
Counting loads without looking at mileage can reward activity instead of efficiency. The same problem occurs with total miles. A truck traveling farther is certainly moving more. That does not tell you whether those miles were productive. This is why fleet managers benefit from looking at several measures together:
- Loaded miles and deadhead miles
- Loaded-to-total-mile percentage
- Loads completed
- Estimated versus actual time
- Shift and load-level mileage variances
- Driver availability and hours remaining
No single KPI tells the whole story. The loaded-mile ratio simply gives fleet utilization a sharper lens.
Driver Hours Make Empty Miles More Expensive
Miles consume more than diesel. They consume the driver's available day. For property-carrying commercial motor vehicle drivers subject to federal HOS (Hours of Service) rules, the FMCSA hours-of-service regulations govern maximum on-duty and driving periods. FMCSA explains that HOS rules establish how long drivers may be on duty and drive, along with required rest periods.
The FMCSA hours-of-service summary states that covered property-carrying drivers may generally drive up to 11 hours after 10 consecutive hours off duty and may not drive beyond the 14th consecutive hour after coming on duty, subject to the applicable regulations and exceptions. That puts another cost on an inefficient assignment.
A long deadhead leg can consume part of a finite driving window without moving a customer's commodity. The dispatcher therefore has more to consider than distance between two dots. Where is the driver now? How much work remains? What assignments fit the available window? Will this load create an awkward empty leg afterward? A fleet that can answer those questions with current dispatch information has a better chance of using both truck capacity and driver time effectively.
A Loaded-Mile KPI Can Help Protect Margin
Fuel prices get attention because they are visible. Deadhead miles can be sneakier. The truck still consumes fuel. Driver time still costs money. Equipment still accumulates mileage and maintenance exposure. Yet the truck is not carrying a load during that leg. That does not mean every deadhead mile is avoidable or unprofitable. Bulk hauling does not work that neatly. It does mean the fleet should know where those miles are occurring.
For a trucking manager, a declining loaded-mile ratio can serve as an early signal to investigate. Maybe customer mix changed. Perhaps dispatch assignments have become less efficient as the fleet grew. Maybe a new operating area is generating more repositioning than expected. For a fleet owner, the same metric can help frame larger questions around pricing, asset utilization, customer profitability, and expansion. That is a much more productive conversation than simply telling dispatch to "cut deadhead miles." Give the team a measurement they can actually see and act upon.
Use Baselines Instead of Chasing a Perfect Number
A useful KPI needs context. Start by measuring current performance rather than announcing an arbitrary target. What is the average loaded-mile percentage across the fleet? How much does it vary by operating area? What does a strong shift look like? Which customers or loads naturally require more repositioning? With that baseline in place, you can spot the routes, loads and operating areas where reducing empty miles can make the biggest difference.
A remote crude operation should not necessarily be benchmarked against a dense local water-hauling route. Geography alone could make the comparison meaningless. Historical baselines are often more revealing. If a particular load typically runs at 72% loaded miles and falls to 58% over several weeks, something changed. That deserves a look.
Likewise, if a dispatcher finds a sequencing approach that moves a group of similar shifts from the low 60s into the 70s, you have an operational improvement worth understanding and repeating. The ratio becomes useful when it leads to a question, then a decision.
Real-Time Visibility Changes the Timing of the Conversation
Traditional fleet reporting often tells you what went wrong after the work is complete. The invoices are being prepared. Payroll is underway. Somebody pulls the numbers and notices a truck spent a surprising amount of the week running empty. Useful insight. Terrible timing. Real-time dispatch analytics move that conversation closer to the work.
PakEnergy Transportation provides real-time location visibility and centralized load lifecycle management, while its advanced dispatch board exposes mileage and time information as dispatchers work through the day's assignments. If an upcoming assignment creates an ugly deadhead leg, the dispatcher has a chance to see it while alternatives may still exist.
Maybe another driver is better positioned. Maybe two loads can be sequenced differently. Perhaps the assignment still makes sense once the full shift is considered. The point is not that software makes the decision. It gives the dispatcher more of the information needed to make one.
Your Best Dispatcher Still Needs Better Visibility
Dispatching bulk commodities has always required judgment. Software does not know every quirk of a customer, every lease road, every driver's strengths, or the dozen unwritten details an experienced dispatcher carries around in their head. That knowledge is valuable.
It becomes more useful when paired with current operational data. Instead of remembering that a particular run "usually has a lot of deadhead miles," the dispatcher can see loaded and empty mileage. Instead of guessing how a reassignment changes the driver's day, updated time and mileage can provide another point of reference.
PakEnergy's advanced dispatch board was specifically designed to help dispatchers identify inefficiencies within a driver's shift. That supports the person making the call rather than trying to replace them. Good dispatch still needs a good dispatcher.
From Deadhead Reduction to Fleet Economics
Reducing deadhead miles is a worthwhile goal, but it is only one piece of a larger question. How effectively are we using the fleet we already have? The loaded mile ratio helps answer that. It shows how much of a truck's movement is occurring under load. Shift and load-level analytics show where inefficiencies are appearing. Real-time location and dispatch information help teams consider alternatives before the day is finished.
Over time, those measurements can inform decisions beyond dispatch. Which loads consistently use trucks efficiently? Which customers create difficult repositioning patterns? Where does the fleet have capacity? When does adding another truck make sense, and when could better utilization create room without another asset? Those are profitability questions. The answers start with knowing what your trucks are actually doing between pickup and drop-off.
Make Every Mile Easier to Account For
 A truck does not have to be parked to be underutilized. It can be rolling down the highway, burning fuel and chewing through available driver hours while carrying nothing at all. That is why fleet owners need more than a count of trucks, loads, or total miles.
By connecting dispatch and transportation workflows, operators can put loaded mileage, deadhead mileage, routing, driver activity, and load information into a clearer operational picture.
You will never eliminate every empty mile. But you can stop treating those miles like an invisible cost of doing business. Measure them. Put them in context. Then give dispatch the information to make the next shift better.
Ready to Put Your Fleet Miles to Work?
PakEnergy Transportation gives bulk haulers real-time dispatch visibility into loads, routes, loaded miles, deadhead miles, and driver shifts so teams can spot inefficiencies while there is still time to act. See what changes when fleet utilization becomes something you can measure throughout the day. Schedule a PakEnergy Demo.
FAQs
What is the loaded mile ratio?
The loaded mile ratio measures the percentage of total vehicle miles traveled while carrying a load. It can be calculated by dividing loaded miles by total miles and multiplying by 100.
What is the difference between loaded miles and deadhead miles?
Loaded miles are traveled while the truck is carrying a commodity. Deadhead miles generally refer to miles traveled without a load, often while repositioning for the next pickup or returning from a delivery.
What is a good loaded-mile percentage for a bulk hauling fleet?
There is no universal percentage that fits every bulk hauling operation. Geography, commodity, customer locations, operating area, load patterns, and other constraints affect how much empty travel is required. Fleet managers can get more meaningful insight by establishing internal baselines and comparing similar routes, shifts, and operating areas.
Can PakEnergy Transportation track loaded and deadhead miles?
Yes. PakEnergy's advanced dispatch board displays loaded miles, deadhead miles, variances, estimated times, and loaded-to-total-mile percentage at shift and load levels.
Does PakEnergy Transportation update mileage when dispatchers rearrange loads?
PakEnergy Transportation documents automatic updates to time and mileage when loads are added, removed, rearranged, or rerouted on the advanced dispatch board. Its support documentation notes specific scenarios that have required manual refreshes, so behavior can depend on the action and current software release.
Why should trucking managers track loaded-mile percentage instead of load count alone?
Load count does not account for the distance traveled between assignments. Loaded-mile percentage adds context by showing how much of total vehicle movement occurred while carrying a load, helping managers identify shifts or routes that warrant closer review.
How can dispatch analytics improve fleet profitability?
Dispatch analytics can help managers identify inefficient assignments, excessive empty mileage, route patterns, and underused fleet capacity. Those insights can support decisions involving dispatch, scheduling, pricing, customer mix, and equipment utilization.